


A-mode ultrasound used graphs to show organs
A-mode was an ultrasound imaging method that was used to find the depth of an organ and also deduce the organs dimensions. Sometimes it is called amplitude mode. When the ultrasound beam was aimed at an anatomical feature, the received echo was processed as a vertical reflection of a point. The resulting display showed the amplitude spikes of different heights. The intensity of the spikes and the time it took to receive them created a graph. The transducers of the day were crude and did not give much detail. The area scanned could not show the exact direction of the scan, what it bounced off of, or the shape of the object. It seems to work well when measuring bone density and is still used in that capacity today. "There is significant variation in the thickness of cranio-maxillofacial bone. Bone thickness is essential information that enhances the success and safety of operations in this area."[1]
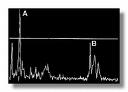
The scan was in graph form
It became obsolete when
B-mode,
or brightness mode technology took over later. In the 1930's, Dr. Karl Dussik first tried to diagnose brain tumors with this imaging equipment. He was first to do a cranial ultrasound and also the first ultrasound in early pregnancy. Please check
how it works
For more on Dr. Karl Dussik, click here
Back to ultrasound physics
From A-mode to Genesis ultrasound machine Home page
[1]Hakim, S.; Watkin, K.L.; Elahi, M.M.; Lessard, L.Engineering in Medicine and Biology Society, 1997. Proceedings of the 19th Annual International Conference of the IEEE